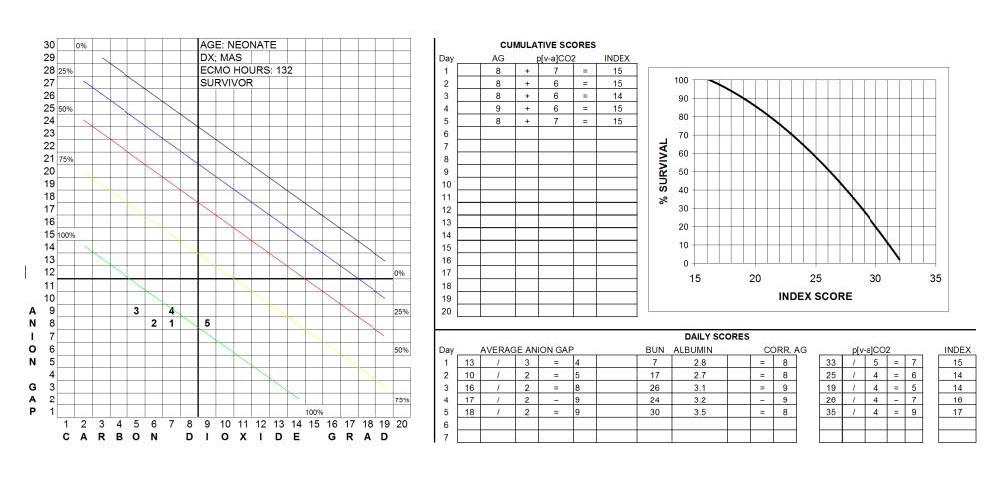
Example 1. Score sheet illustrating the progression of the daily Viability Index Score and the Cumulative (average) Viability Index Score. The VIS and CVIS are low due to early intervention. The patient survived.
A VI score sheet illustrates how the VI can be used to monitor a patient’s progress throughout a period of extracorporeal support. In Example 1, under “Daily Scores” the AGc values are averaged. For Day 1, the three uncorrected AG values totaling 13 mEq/L have an average of 4 mEq/L. Correction factors for the BUN and albumin are then used to arrive at the AGc value of 8 mEq/L. The venoarterial CO2 gradient for Day 1 is calculated by adding the five values together for a total of 33. This is then divided by 5 to obtain the average for the day of 7 mmHg. The AGc and the venoarterial CO2 gradient for Day 1 are then added together to obtain the Day 1 Daily VI score of 15. This score is then plotted as a “1” on the grid at the left to represent the Day 1 Daily VI score. Subsequent daily scores are plotted (“2,3,4,etc”) to make possible the visualization of changes in the patient’s intracellular physiology during extracorporeal support.
The diagonal lines in the plot graph represent quartiles of survival; the area around the lowest line having the highest survival and the area around the highest line having the poorest survival. These quartiles are derived from the VI survival curve in the upper right of the score sheet. The curve on this graph is plotted based on the survival of ECMO patients as it relates to the overall VI called the “Cumulative Viability Index Score” (CVIS) of 294 past ECMO patients. The CVIS is the average of the daily VI score averages. The Day 1 CVIS is the same as the Day 1 Daily VI score, but the Day 2 CVIS is the average of the Day 1 Daily VI score and the Day 2 Daily VI score. In this example, the Day 1 CVIS is 15 which is near the highest predicted survival. As long as the CVIS remains high on the survival curve, patient survival with few complications can be expected.
Perfusion Theory is an educational platform for the Oxygen Pressure Field Theory (OPFT). August Krogh’s theoretical concept of the oxygen pressure field is explained and then applied to clinical applications in perfusion practice.