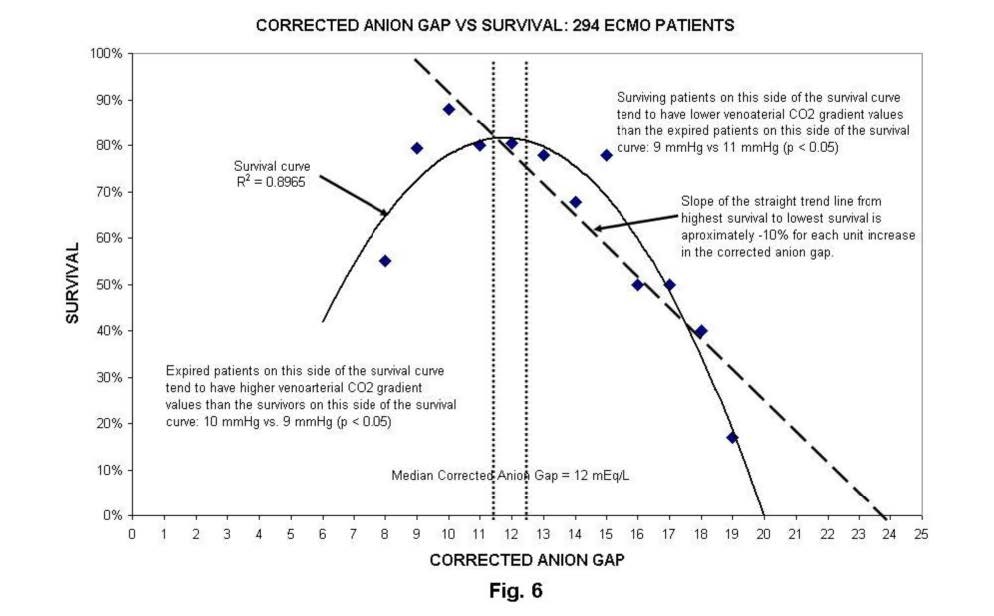
The average AGc value correlated to survival for each of 294 ECMO patients with a variety of diagnoses while on ECMO.
This figure illustrates the average AGc value correlated to survival for each of 294 ECMO patients with a variety of diagnoses while on ECMO. The maximum survival rate of about 90% occurs when the AGc is 10 mEq/L. As the AGc increases survival decreases. Patients with average AGc values of 20 mEq/L or greater have 90% mortality. The slope of this drop from 10 to 20 mEq/L is about -10%, indicating that an increase of 1 mEq/L in the AGc results in a decrease of survival by about 10%.
However an interesting observation occurs with the line of best fit. This line is parabolic in shape with the maximum survival occurring at 10 mEq/L at the top of the curve and survival falling off on either side as the AGc decreases or increases. While it is expected that mortality would increase as the AGc increases, it is surprising to find that mortality increases as the AGc decreases below 10 mEq/L. The AGc is a reflection of changes in intracellular pH due to the accumulation of organic acids in the anoxic lethal corner cells. But if a patient with a low AGc expires it does not mean that the intracellular pH was not low. It simply means that intracellular pH was changed by a mechanism other than the accumulation of organic acid hydronium cations within the cells. In other words, there is a second mechanism besides poor oxygenation that changes intracellular pH.
Perfusion Theory is an educational platform for the Oxygen Pressure Field Theory (OPFT). August Krogh’s theoretical concept of the oxygen pressure field is explained and then applied to clinical applications in perfusion practice.