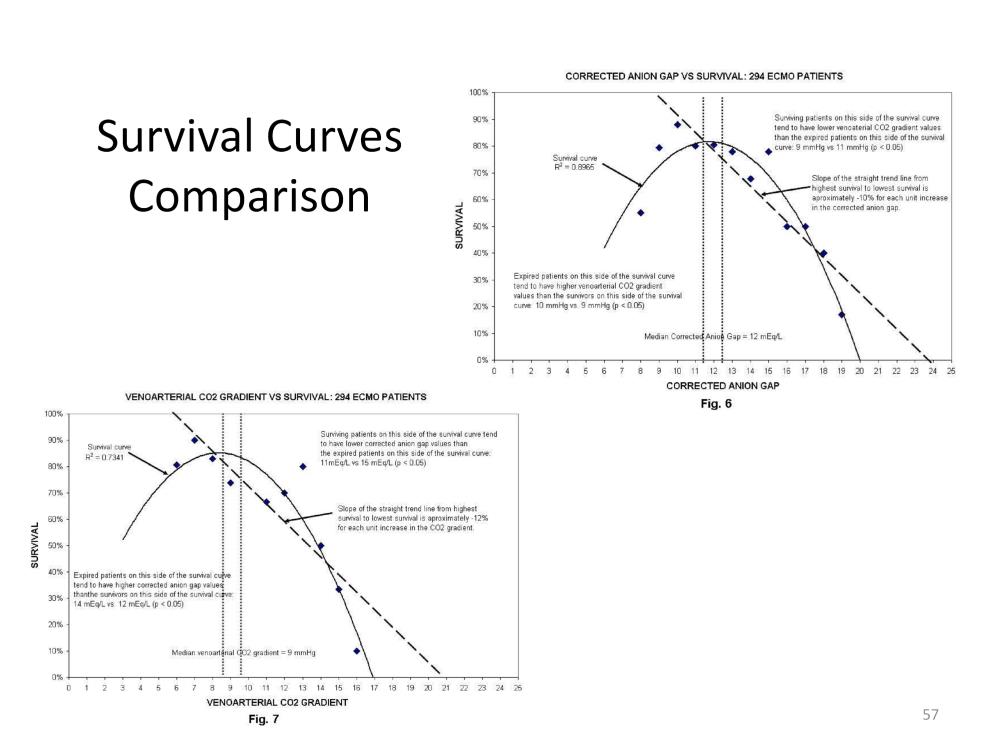
The curve and slope of the AGc and the curve and slope of the venoarterial CO2 gradient are similar. The effect that each has on survival is similar as well. Expired patients with low venoarterial CO2 gradients had high AGc values and expired patients with low AGc values had high venoarterial CO2 gradients. This explains the parabolic shape of the line of best fit in each graph.
The survival slopes for the anion gap and venoarterial carbon dioxide gradient are about the same (-10 vs.-12). So an increase or decrease of one unit by either parameter has a similar impact on survival. If both the AGc and the venoarterial CO2 gradient are high, survival should be the worst. If both parameters are low, survival should be the best. If one value is high its effect might be balanced by maintaining the other parameter in a low range.
Since the AGc and venoarterial CO2 gradient have a similar impact on survival, a ‘Viability Index (VI)’ can be calculated simply by adding the values of the parameters together. Viability is the capability of living normally. Theoretically patients with an elevated VI should have an increased morbidity and mortality. Patients with a low VI should have a low morbidity and low mortality.
Perfusion Theory is an educational platform for the Oxygen Pressure Field Theory (OPFT). August Krogh’s theoretical concept of the oxygen pressure field is explained and then applied to clinical applications in perfusion practice.