The Oxygen Challenge On ECMO
THE OXYGEN CHALLENGE OR HYPEROXIA TEST ON ECMO
The oxygen challenge or hyperoxia test for respiratory ECMO patients makes it easy to evaluate the lungs ability to transfer oxygen. The FiO2 on the ventilator is increased to 100% for 5 minutes. At the end of 5 minutes an arterial blood gas is drawn to test the response. The FiO2 is then returned to a lower level.
The ECMO flow diagram below is of a septic patient on ECMO for respiratory failure over a period of about 6 days. The solid black line represents the arterial pCO2. The red line represents the ECMO blood flow. The green line represents the patient’s arterial pO2. The yellow line represents the FiO2 on the patient’s ventilator. Each yellow spike indicates when the ventilator FiO2 is increased to 100%. This is the ventilator FiO2, not the sweep gas FiO2. This maneuver is called an ‘oxygen challenge’.
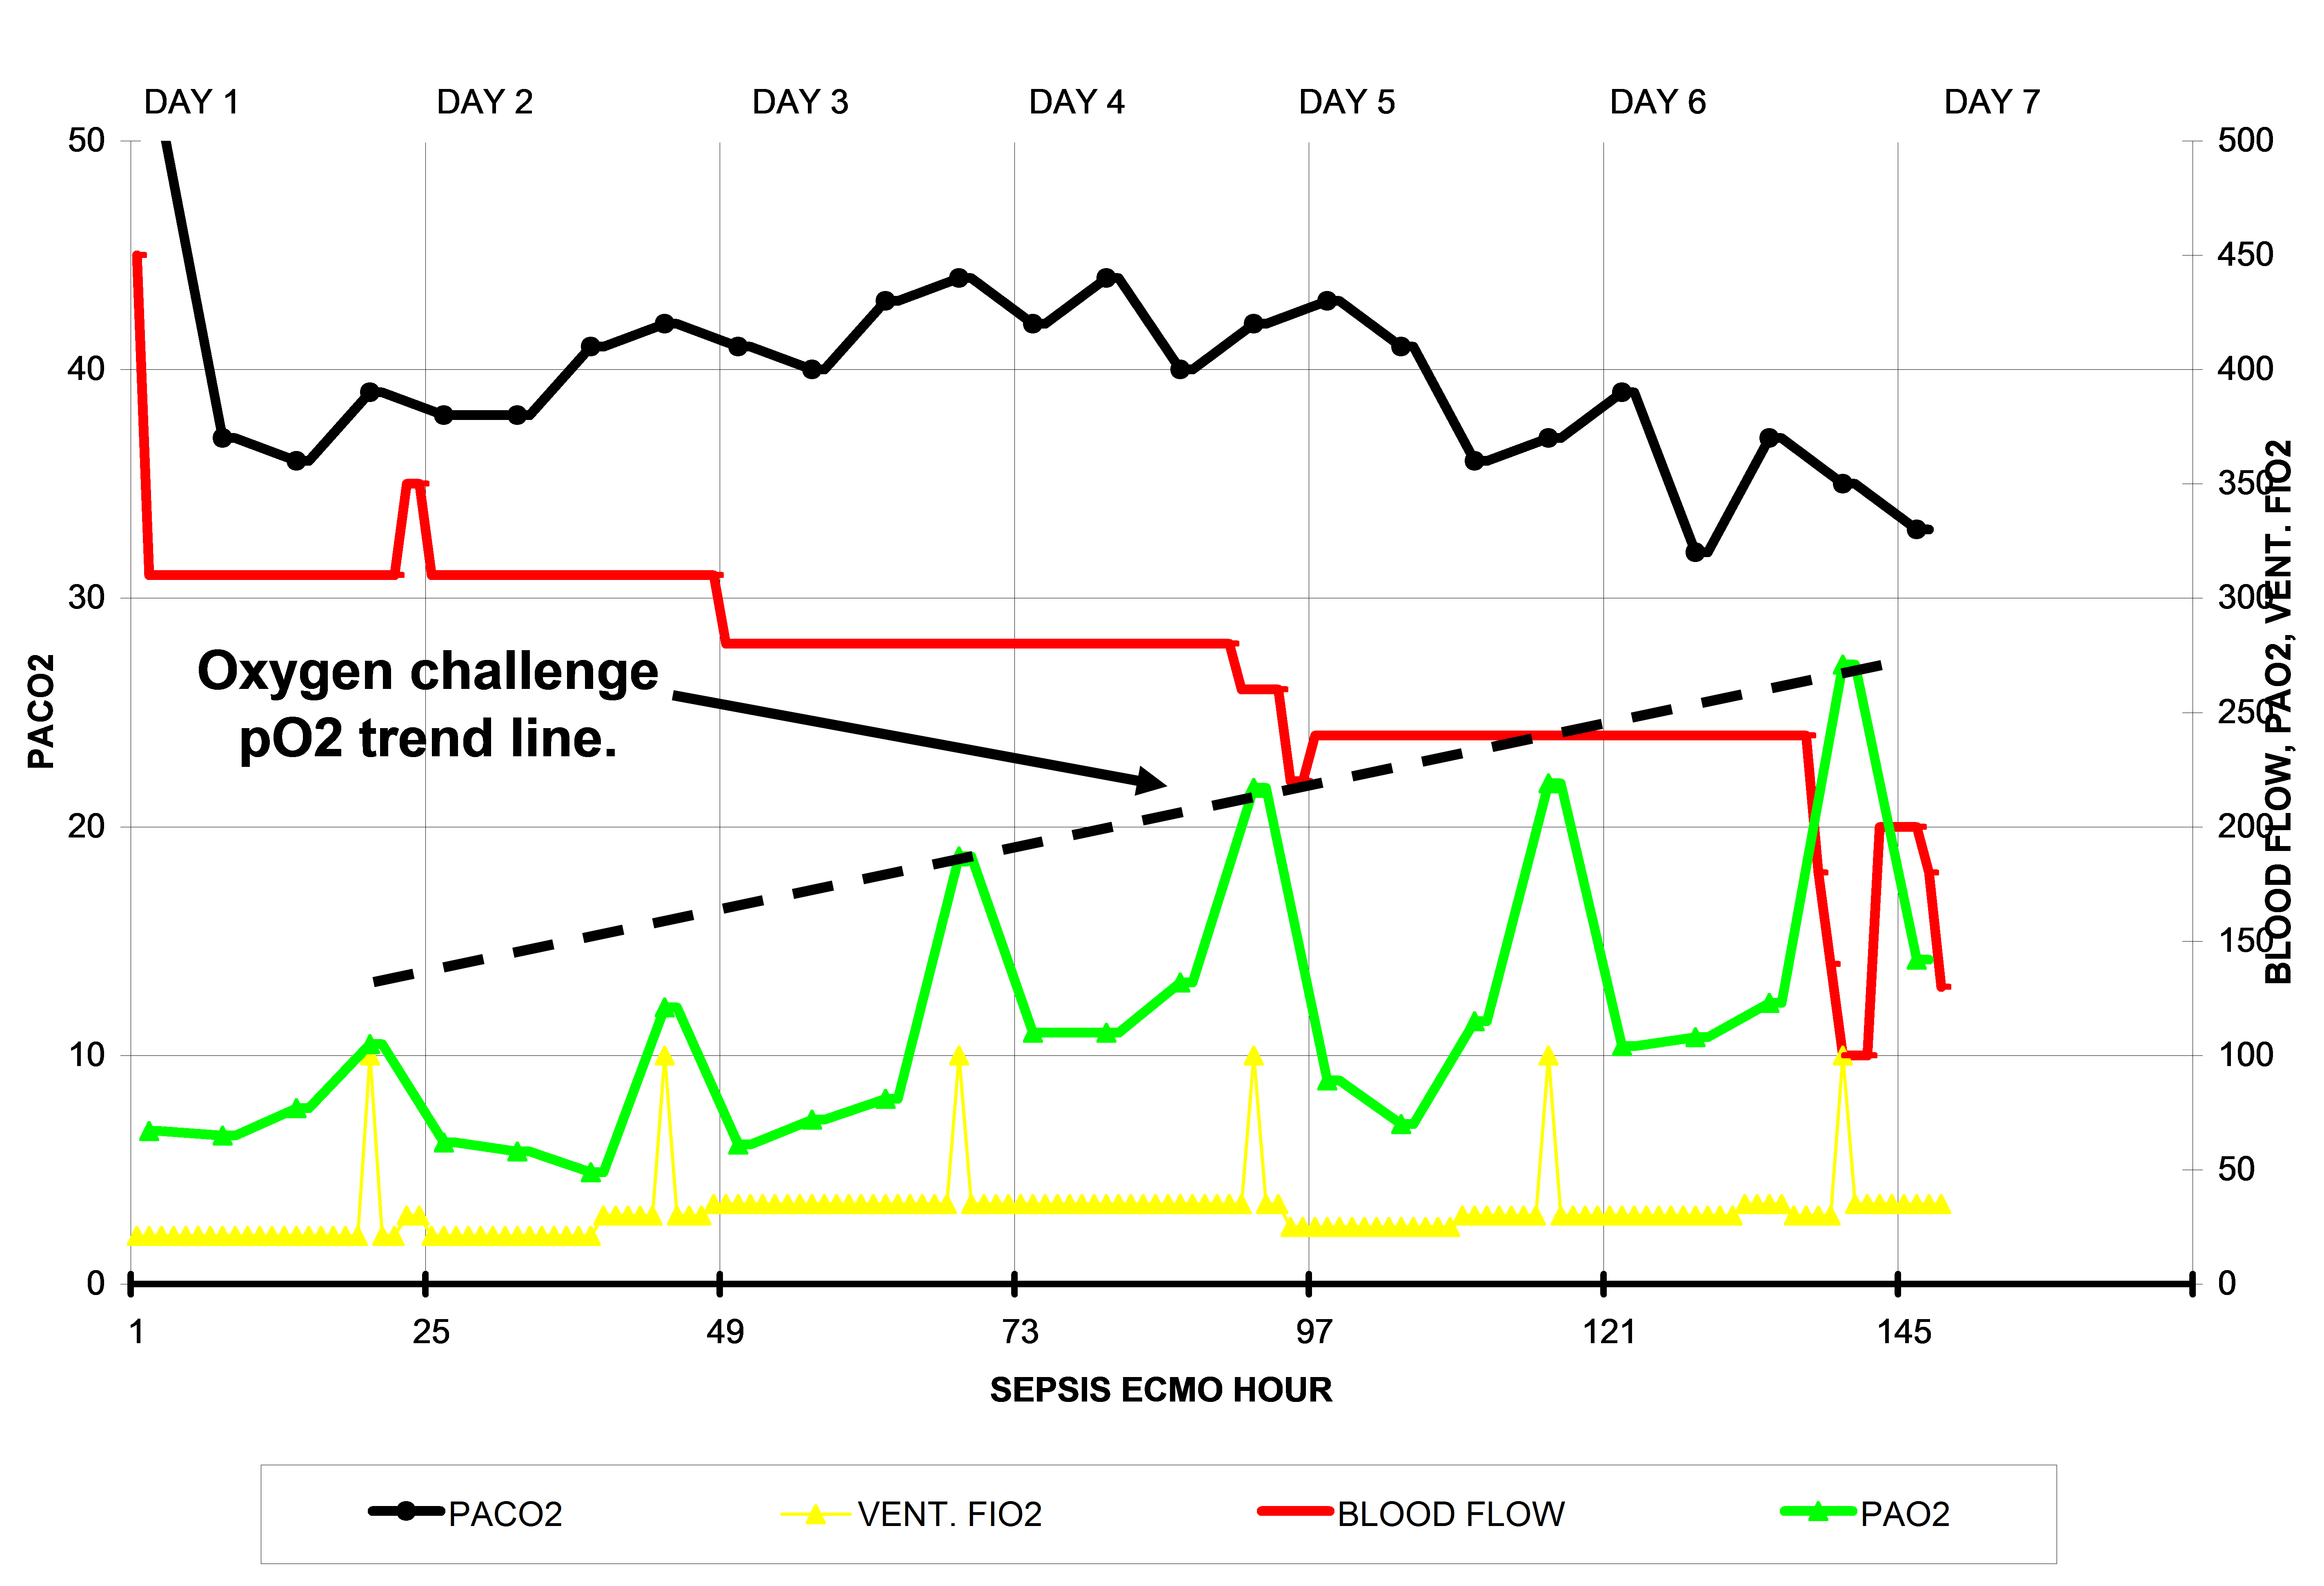
The patient’s poor response in the early days to 100% FiO2 clearly indicates the poor degree of oxygen exchange capacity by the lungs. The low arterial pO2 values at the beginning of ECMO indicate that the heart is expelling lots of de-saturated blood which, even when mixed with the high pO2 blood from the ECMO pump, remains below 75 mmHg for the first 2 days.
As the days progress the patient’s pO2 value gradually increases when the ventilator FiO2 is increased to 100% during the oxygen challenge. On the first day, the pO2 increases to barely over 100 mmHg, but by the 6th day the pO2 has increased to over 250 mmHg. The dotted black line represents the trend in improvement over the 6 days. Typically, when the patient can achieve an oxygen challenge of 250 mmHg under these circumstances, weaning is appropriate.
The ECMO flow diagram below is of a meconium aspiration patient on ECMO for respiratory failure over a period of about 4 days. The oxygen challenge is over 300 mmHg on every day. However, the arterial pO2 values between the oxygen challenge tests show a gradual decrease in the arterial pO2 over the four days on ECMO. This represents the resolution of ‘cardiac stun’ which was probably the occult reason the patient was placed on ECMO.
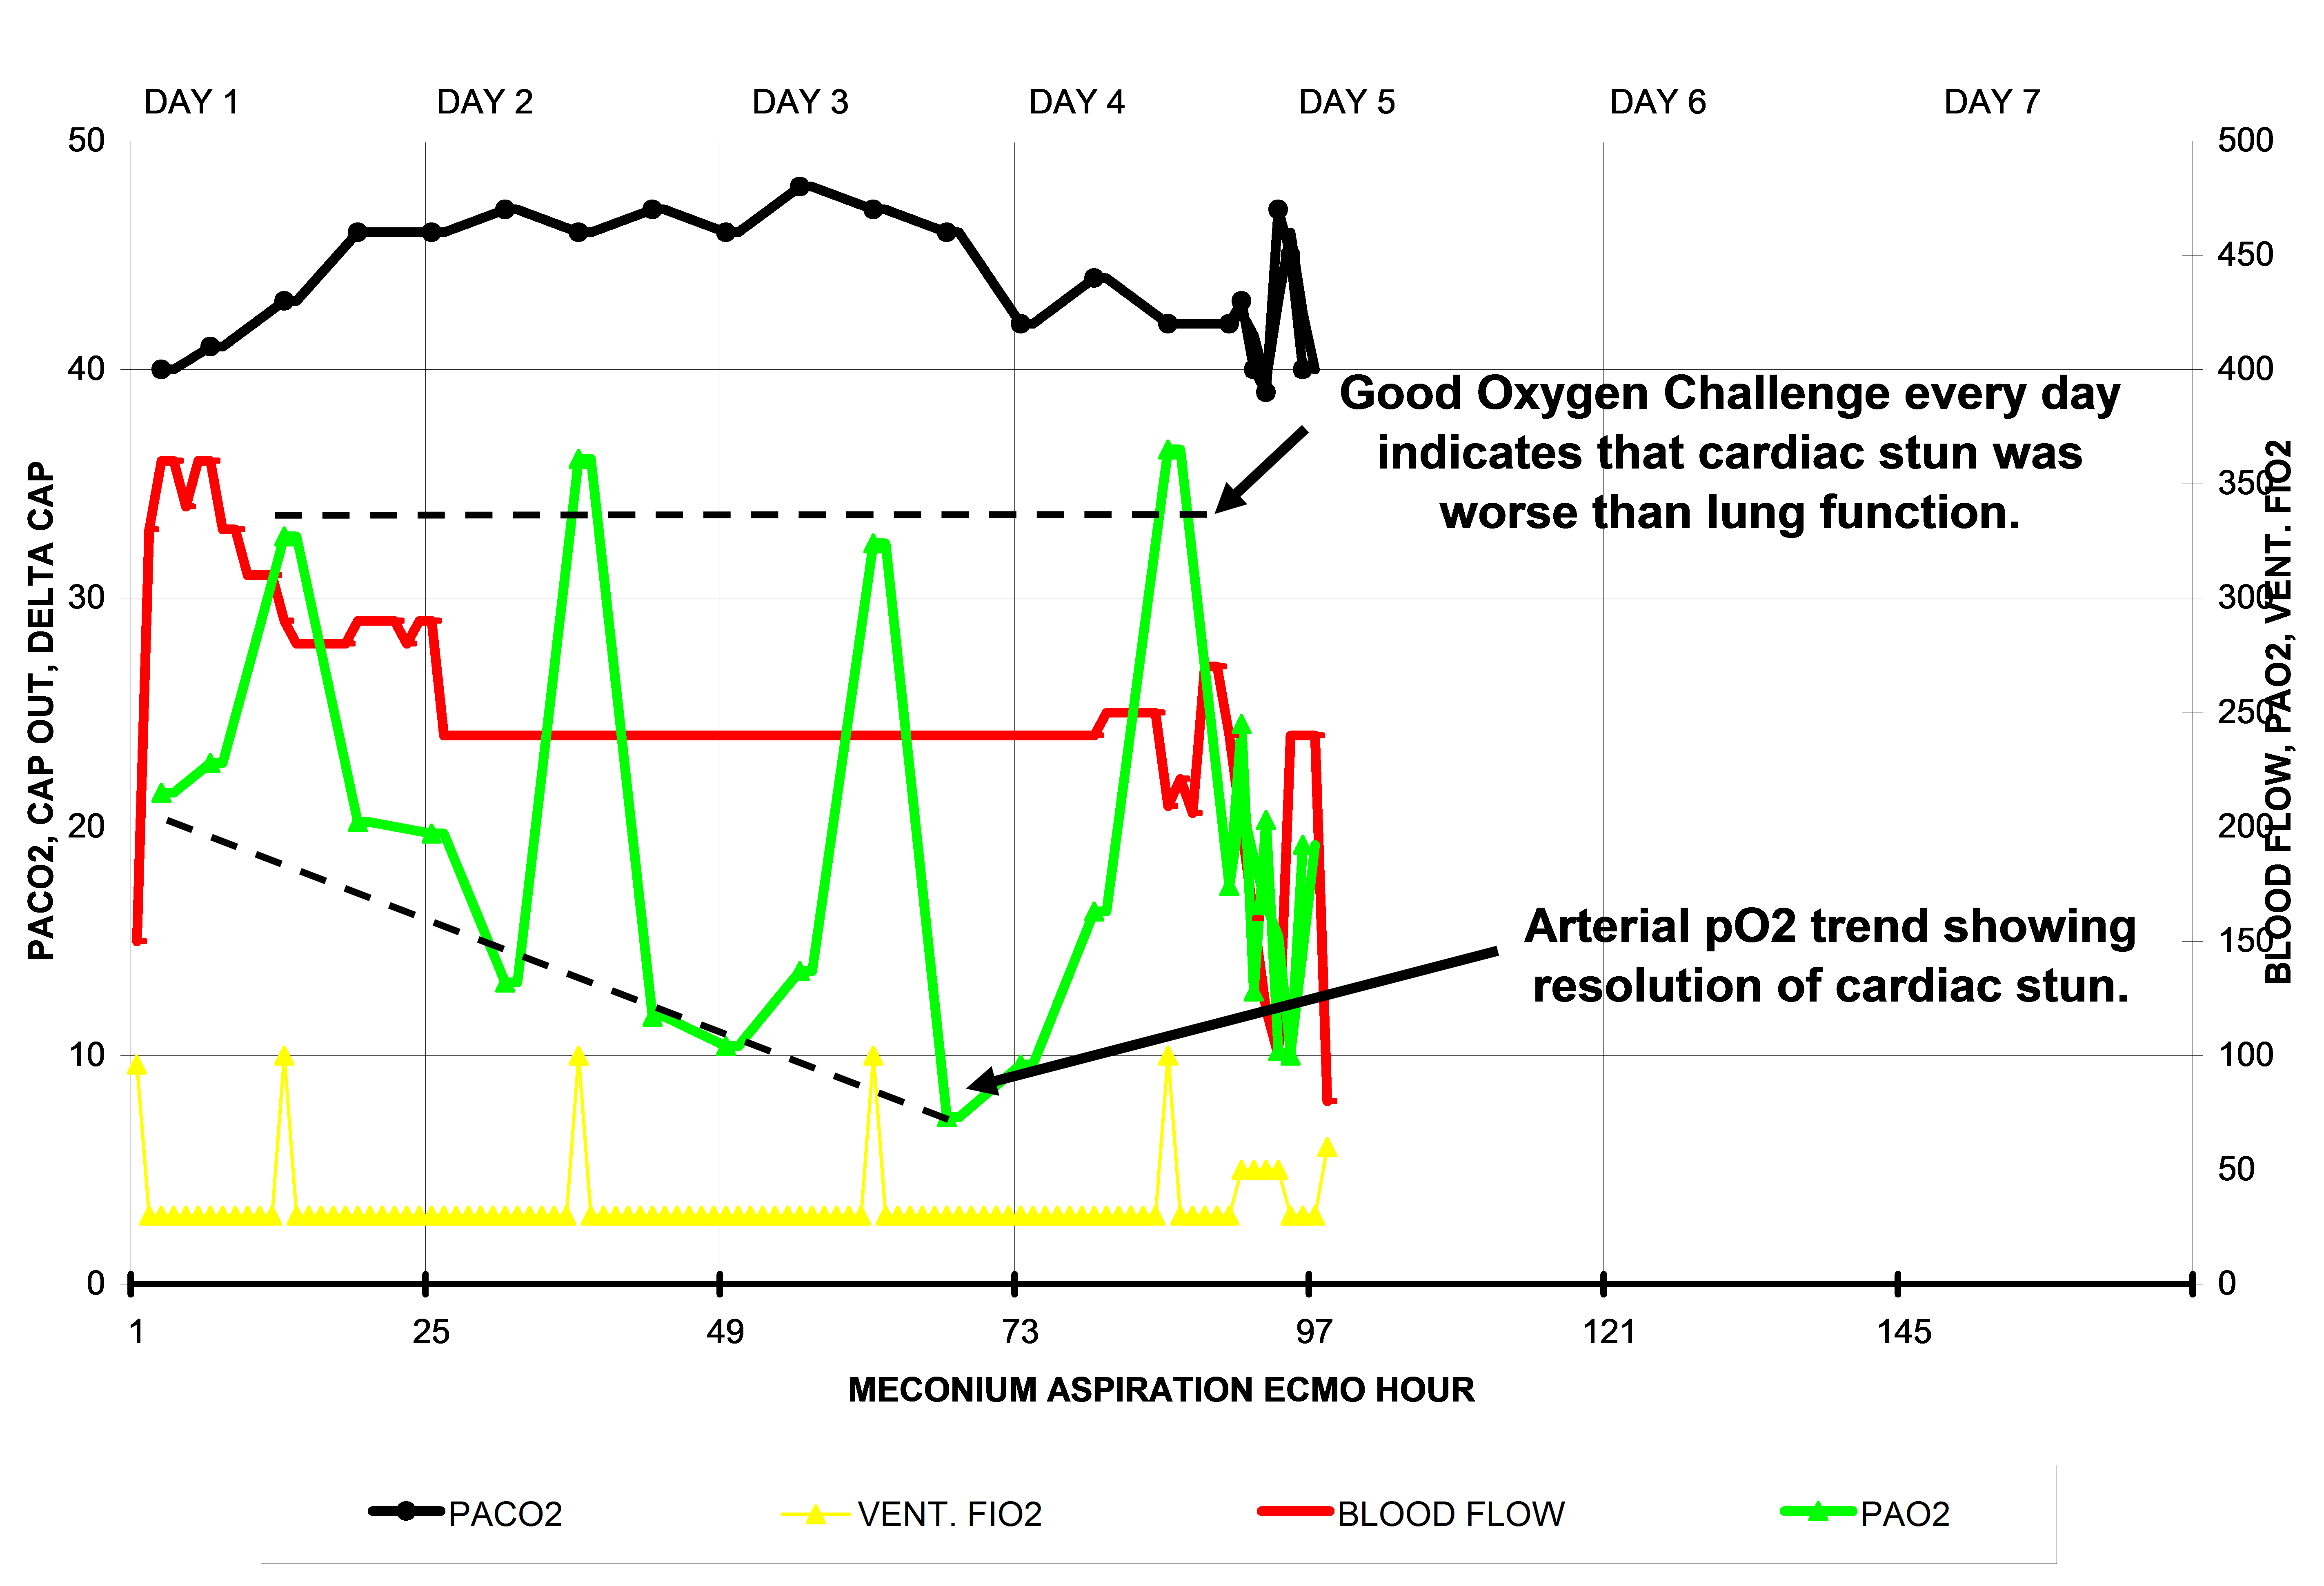
Cardiac stun occurs when a heart is depleted of its high energy ATP molecules or when it is damaged by reperfusion injury, or both. This can happen just prior to ECMO, as in this example, or just after ECMO starts when oxygenated ECMO blood reperfuses the hypoxic heart to cause reperfusion damage, as in the example discussed below.
During ECMO, the heart pumps de-saturated blood into the aorta where it mixes with the ECMO blood. If there is very little blood coming from the heart, the blood in the aorta will be mostly blood from the ECMO pump which has a high pO2 (~250+ mmHg). As the cardiac stun resolves, the heart will pump increasing amounts of de-saturated blood into the aorta to mix with the ECMO pump blood. This causes the blood in the aorta to have lower and lower pO2 values. In this patient the cardiac stun resolved after 3 days. The patient was weaned off on the fourth day of ECMO.
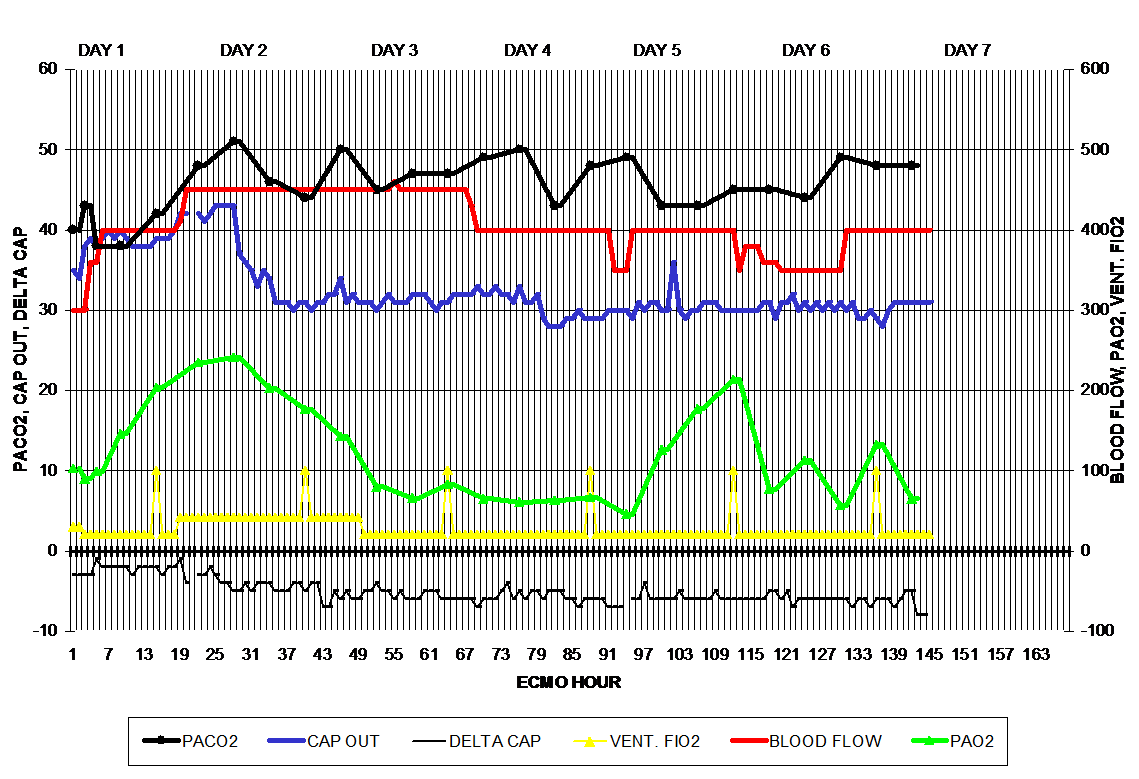
The third diagram (below) illustrates a complete cardiac stun cycle. Soon after the initiation of ECMO the patient’s arterial pO2 value gradually increases from 100 mmHg to 250 mmHg at ECMO hour 26. There after the arterial pO2 gradually falls back to 80 mmHg by hour 50, signaling the resolution of the cardiac stun cycle. During this time period the ventilator was maxed out to 100% only at hours 14 and 42, but otherwise set at 30% or less FiO2. The two oxygen challenges have no perceptible effect on the arterial pO2. Between ECMO hours 50 and 96, the arterial pO2 remains low at less than 100 mmHg and does not respond to the oxygen challenges at hours 66 and 88, indicating a persistent pulmonary hypertension. Between hour 97 and 146 the arterial pO2 is reactive to an increase in the FiO2 indicating readiness to wean from ECMO.
Unlike many cardiac patients, respiratory patients with cardiac stun may still display pulsatility because the ECMO blood flow is less than normally needed in cardiac patients. Although the respiratory patient’s heart is still contracting, it lacks vigor and has little reserve while in stun.
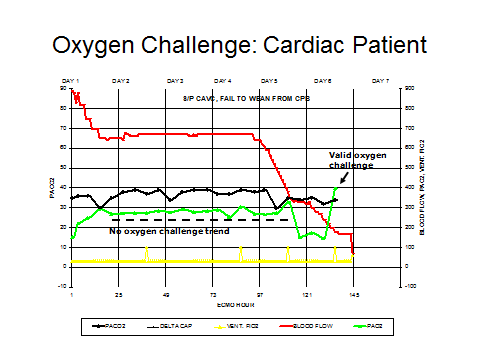
The oxygen challenge is not usually useful in patients with a primary cardiac diagnosis with the exception of a biventricular cardiac patient with pulmonary hypertension. The oxygen challenge in univentricular patients probably does not provide any useful information. The last diagram (below) represents a cardiac surgery patient (complete AV canal repair) who failed to wean from CPB. After being placed on ECMO the arterial pO2 remains at about 250 mmHg through most of the ECMO time period, with no reaction to the oxygen challenges as represented by the yellow spikes. This is because the ECMO blood flow is very high and does not allow very much blood to pass through the lungs to react with the oxygen. The high pO2 values are strictly representative of blood emerging from the ECMO pump. Pulsatility is absent during most of the time at high ECMO blood flow. Once the ECMO blood flow is reduced during weaning, the lungs receive more blood flow, pulsatility returns and the arterial pO2 reacts appropriately to the oxygen challenge.
I had a question about this technique. I would like to implement on our respiratory patients. Do you change the tidal volume also?
Thank you
Cindy- Don’t change the vent settings other than the FiO2. Don’t change the sweep gas either. After 5 minutes of 100% O2 on the ventilator, draw the arterial blood gas. Then reduce the vent FiO2 back to where ever it was before.
-gary
Gary, Thank you for feedback. Do you have any challenges pertaining to a patient who’s indication for ECMO was hypercapnia? We are considering increasing PEEP and PIP for approx. 30 minutes and documenting TV, ET CO2, blood gas…
Thank you
Cindy- First you want to make sure that you are dealing with a true hypercapnea due to pulmonary failure. So you should be looking at simultaneous ABGs and VBGs. The ABGs should be post ductal if in an infant. The VBGs should be drawn from the pump venous line if possible.
Normal hypercapnea should look something like this. See below (pH/pCO2/pO2/base). The p(v-a)CO2 gradient should be 10 or less. If it is over 15, for sure you are dealing with breakthrough hypercapnea, not pulmonary hypercapnea.
7.33 / 56 / 87 / +1.9 : ABG Hypercapnea
7.31 / 66 / 44 / +3.7 : VBG Hypercapnea
CO2 Gradient = 10 mmHg: No complications
If you increase PEEP and PIP, the added chest pressure will worsen CO and make breakthrough hypercapnea immediately worse on the venous side and eventually on the arterial side.
Here is an example of temporary hypocapnea caused by vent setting increases and with worsening venous hypercapnea.
7.35 / 32 / 154 / -7 : ABG Part. Resp. Comp. Metabolic Acidosis
7.29 / 57 / 37 / 0 : VBG Hypercapnea
CO2 Gradient = 25 mmHg: expect a lethal complication
Here is a borderline hypercapnea with severe venous hypercapnea.
7.35 / 43 / 55 / -1.9 : Normal ABG
7.19 / 74 / 20 / -1.7 : VBG Severe Hypercapnea
CO2 Gradient = 31 mmHg: expect a lethal complication
Here is a mild breakthrough hypercapnea with severe venous hypercapnea.
ABG = 7.27 / 48 / 430 / -6 Mild break through hypercapnea
VBG = 7.09 / 84 / 25 / -6 Sever e venous hypercapnea
CO2 Gradient = 36 mmHg: expect a lethal complication
Here is a another mild breakthrough hypercapnea but with lethal venous hypercapnea.
7.31 / 48 / 375 / -2 : ABG Breakthrough Hypercapnea
<6.90 / 106 / 27 / ? : VBG Severe Hypercapnea
CO2 Gradient = 58 mmHg: expect a lethal complication.
If you are dealing with true pulmonary hypercapnea, I think that daily TV and O2 challenge will tell you if the lungs are improving. If you are on VA ECMO I don't think ET will be much help until the blood flow is reduced substantially. Ultrafiltration may also help, particularly if you are on VV ECMO.
If you are dealing with breakthrough hypercapnea the treatment is to increase blood flow if you are on VA ECMO. This will put more blood through the capillaries and remove CO2 from the tissues better. If you are on VV ECMO, use some inotropes to improve CO.
Once you are off ECMO you should continue with ABGs and VBGs at least every 6 hours to be sure.
That's all I can offer without more info.
Good luck.
-Gary
What is breakthrough hypercapnea compared to pulmonary hypercapnea? is it reduced perfusion hypercapnea, low COP with high Art venous CO2 gradient
Ayman-
Breakthrough hypercapnea occurs when the excess CO2 in the venous blood is not removed by pulmonary function and breaks through to result in an elevated arterial pCO2. Often, the response by intensivists is to increase the ventilator pressures and minute volume in an effort to reduce the arterial hypercapnea. While this may work over a short period, the more aggressive vent settings impair the cardiac output which eventually worsens both the venous and arterial hypercapnea. You could call it “reduced perfusion hypercapnea”. The venoarterial gradient will always be abnormally high, but colloid osmotic pressure (COP) does not necessarily play a role.
Pulmonary hypercapnea is the more familiar arterial hypercapnea that occurs when pulmonary function is reduced, either by the patient’s failure to breathe adequately or too low of ventilator settings.
Hi can you explain how 100% oxygen is delivered into the ecmo machine
Lynn-
The oxygen challenge does not involve putting 100% oxygen into the ECMO. Rather the patient’s ventilator oxygen is increased to 100% for five minutes. Then blood gases are drawn to see what the reaction is. Does this answer your question?
-Gary
Hi,
What FiO2 would you set for the first five minutes in a cardiac arrest? We are setting a new protocole for our hospital
Thank you
Eva
Eva
In a nutshell, put the coding patient on ECMO using a cold (room temp), calcium free prime, with an ECMO FiO2 of .21%. Get the flow up and allow the patient to cool to 32C. Look at the pvCO2 – pt. arterial pCO2 gradient. Once it gets below 15 mmHg you can start increasing the ECMO FiO2. Once the patient is on ECMO (ECPR) reduce the ventilator FiO2 to 30%.
Getting the pvCO2 – pt. arterial pCO2 gradient down below 15 mmHg is the best indicator that the potential for reperfusion injury is resolving.
There is an article in this web site that explains what to do: https://perfusiontheory.com/the-physiology-of-ecpr/
Gary
This is a strategy to address the potential reperfusion injury that all coding patients experience. But read the whole article.
Gary